

Download the Startup Financial Model Template in Microsoft Excel, OpenOffice Calc, and Google Sheets to prepare financial projections for 3 years for your startup.
Just insert data for the first year. The template will automatically prepare the remaining 2 years of Income Projections, Sales Projections, Cash Flow Statements, Balance Sheets, and Break-even Analysis for your startup.
This template can be useful if you plan to get a business loan from banks or raise capital for your startup from private investors.
Table of Contents
Download Startup Financial Model Template (Microsoft Excel, Google Sheets & OpenOffice Calc)
We have created a ready-to-use 3-year Financial Projection Model For Startups to help you easily prepare Income Projections, Sales Projections, Cash Flow Statements, Balance Sheets, and Break-even Analysis for your startup.
This extremely useful Startup Financial Model Excel Template was voluntarily contributed by Kirti Tiwari, MBA Finance, Gold Medalist.
She has prepared this Startup Financial Model and also provided related explanations. Highly Appreciated.
Click on the link below to download your desired format.
Additionally, you can download the Income Statement Projection Template, Balance Sheet Template With Analysis, Cash Flow Statement Template, and Break-even Analysis Template depending on your requirements.
In case, you want to customize any of the above templates feel free to contact us. You can hire us for our services on Fiverr or contact us at info@msofficegeek.com.
How To Use Startup Financial Model Excel Template?

INTRO Sheet: Enter the preparer name, Company name, Starting Month, and Starting year. The Company name will be reflected in all the sheets ahead.
Startup Expenses

Startup Expenses (Year 1): Insert applicable data in the white cells. Orange cells contain formulas, hence do not enter or delete the cells.
Payroll Expenses

Payroll Expenses (Year 1): Insert applicable data in the white cells. Orange cells contain formulas, hence do not enter or delete the cells.
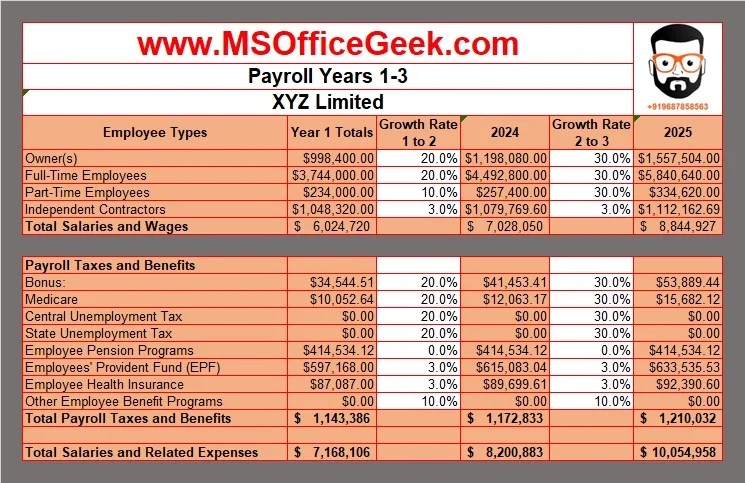
Payroll Expenses (Year 2 and Year 3): Insert the growth rate percentage to populate the cells automatically.
Sales Forecast
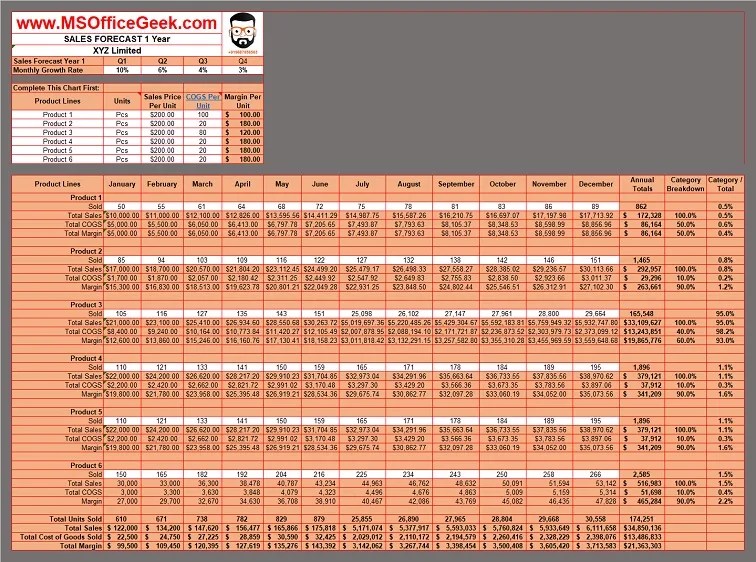
Sales Forecast (Year 1): Insert product names, Units, Sales Price per unit for each product, and COGS per unit. It calculates the Margin per unit for each product automatically.
Additionally, insert sales of units for each product in each month and it will calculate the rest.

Sales Forecast (Year 2 and Year 3): Insert Sales Growth Rate at the top for year 2 and year 3 and it auto-populates the sheet for you.
Other Expenses

Additional Information: Insert other startup-related costs such as schedules for Accounts Payable, Accounts Receivable, Amortization, Income Tax, and Depreciation.
Operational Expenses

Operational Expenses (OPEX Year 1): Insert applicable data in the white cells. Orange cells contain formulas, hence do not enter or delete the cells.

Operational Expenses (OPEX Year 2 and Year 3): Insert the growth rate percentage to populate the cells automatically.
Cashflow Forecast

Cash Flow (Year 1): Based on the entries in the previous sheets, the sheet auto-populates the data. Insert data in white cells if applicable to your business.

Cash Flow (Year 2 and Year 3): No need to enter any data in this sheet because it auto-populates the data based on previous entries.
Amortization & Depreciation Schedule
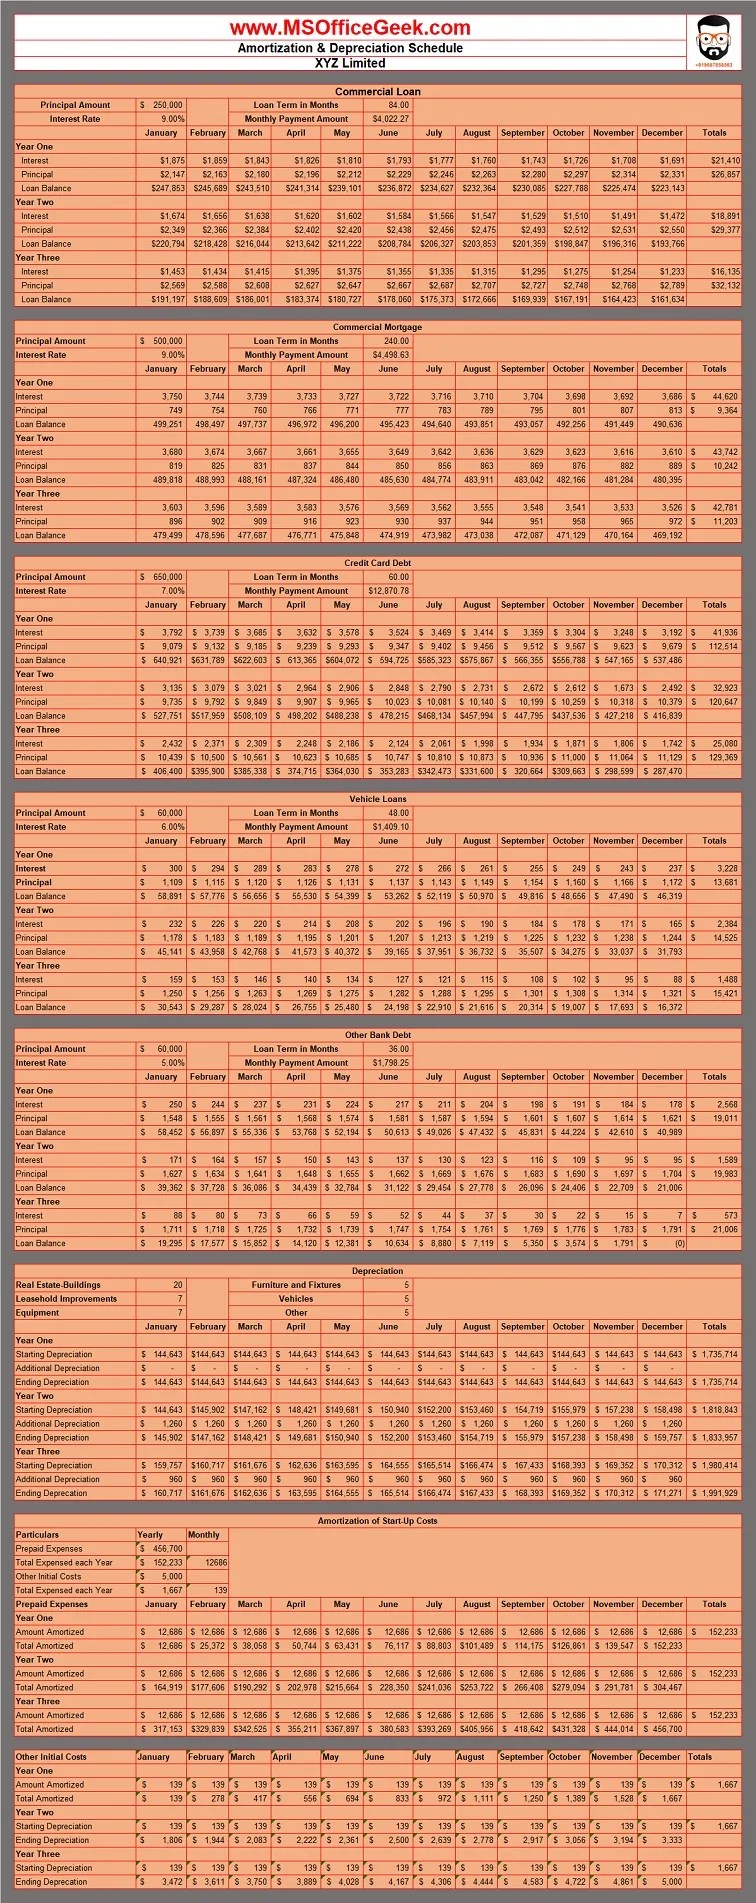
Amortization and Depreciation: This sheet consists of monthly amortization and depreciation schedules for 3 years for all the different heads. No need to enter any data in this sheet because it auto-populates the data based on previous entries.
COGS

COGS: Insert applicable data in the white cells. Orange cells contain formulas, hence do not enter or delete the cells.
Income Statement Projections

Projection Income Statement (Year 1): No need to enter any data in this sheet because it auto-populates the data based on previous entries.

Projection Income Statement (Year 2 and Year 3): No need to enter any data in this sheet because it auto-populates the data based on previous entries.
Balance Sheet

Balance Sheet: This sheet auto-populates the Balance Sheet for all three years. Hence, there is no need to enter any data.
Breakeven Analysis

Breakeven Analysis: This sheet auto-populates the Balance Sheet for all three years. Therefore, there is no need to enter any data in this sheet.
Financial Ratios

Financial Ratio: This sheet auto-populates the Balance Sheet for all three years. Therefore, there is no need to enter any data in this sheet.
That’s it and your Financial Projection for Startup is ready.
The template is self-explanatory. If you want more information on what things and figures you need to input in the sheet we have made a comprehensive guide for you below.
Startup Balance Sheet
A startup balance sheet is a snapshot of your company’s financial health at a specific point in time. It shows what you own (assets), what you owe (liabilities), and the value of your owners’ equity. It’s crucial for both internal decision-making and external communication, especially when seeking funding or partnerships.
In the whirlwind of building your dream startup, understanding your financial landscape is crucial. That’s where the startup balance sheet comes in, your financial snapshot at a specific time. Like a map guiding your next steps, it reveals what you own (assets), what you owe (liabilities), and the value of your ownership (equity).
Importance of Startup Balance Sheet
- Track your progress: Monitor your financial journey, celebrating milestones and identifying areas for improvement.
- Stay ahead of curves: Early detection of potential cash flow shortfalls or overly burdensome debt empowers you to make proactive decisions.
- Unlock new avenues: Investors heavily rely on balance sheets to evaluate the financial health of the business and make informed investment decisions.
- Guide your growth: These data-driven insights inform strategic choices about resource allocation, investments, and financing.
Fixed Assets
Fixed assets are the long-term, tangible property or equipment a company owns and uses to generate income or run its operations. They are expected to last for more than one year and are not easily converted into cash.
Key Characteristics of Fixed Assets
- Durability: They are expected to have a useful life of more than one year.
- Not for resale: They are not intended to be sold in the ordinary course of business.
- Used for production or operations: They are used to generate revenue or support business activities.
- Depreciated over time: To reflect their wear and tear and loss of value, fixed assets are depreciated over their useful lives, except for land.
Importance of Fixed Assets
Essential for operations: Fixed assets are often crucial for a company’s ability to produce goods, provide services, and generate revenue.
Significant investment: They can represent a significant portion of a company’s total assets and investment.
Impact on financial statements: Their value and depreciation affect a company’s financial statements, including its balance sheet, income statement, and cash flow statement.
Startup Operating Capital
Operating capital, the lifeblood of your startup, is the short-term financial resources needed to keep your business humming day-to-day. Think of it as the oil that lubricates your gears, ensuring smooth sailing through daily operations.
Components of Operating Capital
Operating capital covers a range of essential expenses, including:
Inventory: Raw materials, finished goods, and anything awaiting sale.
Payroll: Salaries and benefits for your amazing team.
Marketing and Sales: Reaching your target audience and converting leads.
Rent and Utilities: Keeping the lights on and doors open.
Administrative Costs: Paperclips, office supplies, and other essentials.
Importance Of Operating Capital
Sufficient operating capital ensures your startup can thrive in the fast-paced world of business.
It helps you:
Meet immediate obligations: Avoid late payments and maintain supplier relationships.
Seize opportunities: Grab limited-time deals or invest in quick-win marketing campaigns.
Weather unforeseen challenges: Handle unexpected expenses without breaking a sweat.
Maintain flexibility: Adapt to changing market conditions and pivot if needed.
How To Estimate Your Needs For Operating Captial?
Determining your operational capital needs takes careful planning. Consider factors like:
Industry standards: Research average operating capital requirements for your industry.
Business model: Analyze your projected sales and expenses to understand cash flow patterns.
Growth plans: Factor in upcoming milestones and potential scaling needs.
Securing operational capital can be achieved through various means:
Bootstrapping: Using personal savings or funds from friends and family.
Bank loans: Seeking traditional or short-term business loans.
Investor funding: Attracting venture capitalists or angel investors.
Line of credit: Accessing a flexible source of credit for ongoing needs.
Startup Funding Sources
Kickstarting your entrepreneurial journey requires securing initial capital which fuels your venture dream into reality. Funding sources are the sources from where your capital needs are met.
Thankfully, a diverse landscape of funding sources awaits, each with its advantages and considerations.
Key Funding Sources
Bootstrapping: A true test of grit and self-reliance, bootstrapping involves leveraging personal savings, family loans, or even credit cards to fund your initial operations. This approach offers autonomy and avoids external pressures, but comes with limited capital and potential personal financial strain.
Angel Investors: These wealthy individuals with a penchant for promising ventures can inject crucial capital in exchange for equity or convertible debt. The process often involves pitching your vision and demonstrating traction, making it crucial to have a well-honed narrative and compelling business plan.
Venture Capitalists (VCs): Geared towards high-growth potential startups, VCs invest larger sums for significant equity stakes. Expect rigorous due diligence and intense scrutiny, but also gain access to expertise, mentorship, and valuable networks.
Business Loans: Traditional bank loans or lines of credit offer secured funding based on business potential and personal creditworthiness. While less dilutive than equity options, they come with stricter repayment terms and interest rates.
Government Grants and Programs: Specific initiatives supporting innovation and entrepreneurship may offer grants or subsidized loans, often focused on sectors like technology or social impact. Research relevant programs and tailor your application to their criteria.
Crowdfunding: Platforms like “ZestMoney”, “Fueladream”, “Crowdfund India” etc. allow you to raise capital from a large pool of individual investors in exchange for rewards or pre-orders. This approach can be effective for building community and generating early buzz but requires a compelling campaign and marketing strategy.
Startup Payroll Expenses
Payroll, in essence, is the lifeblood of your startup. It’s the system for calculating and distributing compensation to your team – the talented individuals who breathe life into your vision. It encompasses wages, salaries, bonuses, taxes, deductions, and all the intricate details that ensure your people get paid correctly and on time.
Why You Need to Get This Right from the Start?
Attract and Retain Top Talent: Competitive and accurate payroll sets the tone for your company culture. It demonstrates respect for your team’s contributions and fosters trust, attracting and retaining the best minds who can accelerate your growth.
Compliance is Key: Navigating the intricacies of labor laws, tax regulations, and social security contributions can be tricky, especially for early-stage businesses. Proper payroll management mitigates risks, avoiding legal woes and fines that can derail your trajectory.
Efficiency Matters: Manual payroll calculations are time-consuming and prone to errors. Investing in reliable payroll software or outsourcing to a skilled payroll provider frees up your valuable time and resources for more strategic endeavors.
Transparency Builds Trust: Clear and transparent pay structures with accurate paystubs go a long way in fostering trust and motivation within your team. It empowers your employees to track their earnings and understand their compensation package.
Data-Driven Insights: Properly structured payroll data becomes a valuable asset. You can analyze trends, identify cost-saving opportunities, and make informed decisions about employee compensation and benefits to optimize your workforce investments.
Startup Sales Forecast
A sales forecast is an estimate of how much revenue a company expects to generate from its products or services during a specific period, typically a quarter, a year, or several years.
It’s a crucial tool for business planning, as it helps companies:
Understand future demand: Forecasting future sales helps businesses allocate resources efficiently, plan production schedules, and set realistic sales targets.
Make informed decisions: Sales forecasts inform budget decisions, marketing campaigns, inventory management, and even hiring plans.
Monitor performance: Comparing actual sales to the forecast helps track progress and identify areas for improvement.
Techniques for Sales Forecasting
There are several methods for forecasting sales, each with its strengths and weaknesses. Some common techniques include:
Historical data analysis: Analyzing past sales trends and seasonality can provide valuable insights for future projections.
Causal models: These models consider external factors like competitor activity, economic conditions, and marketing campaigns to estimate their impact on sales.
Expert judgment: Consulting with experienced salespeople or industry experts can provide valuable qualitative insights.
Statistical methods: Advanced statistical techniques like regression analysis can identify complex relationships between various factors and sales.
Benefits of Accurate Sales Forecasts
Having accurate sales forecasts offers several benefits, including:
Improved financial planning: Businesses can allocate resources more effectively, manage cash flow, and secure funding with greater confidence.
Enhanced decision-making: Accurate forecasts help companies make informed decisions about production, pricing, inventory, and marketing strategies.
Boosting operational efficiency: Businesses can optimize production schedules, workforce planning, and logistics to meet future demand efficiently.
Increased profitability: By anticipating market trends and customer needs, companies can make strategic decisions that maximize revenue and profitability.
Formula for Sales Forecast
While there’s no single formula universally applicable to all sales forecasts, a common starting point is:
Projected Sales = (Average Unit Price) x (Estimated Units Sold)
This formula requires estimates for both the average price per unit and the number of units to be sold. The accuracy of the forecast depends on the reliability of these estimates, which can be derived from historical data, market research, and expert judgment.
Additional factors to consider Sales Forecasting
Besides the techniques and formula mentioned above, several other factors can impact the accuracy of your sales forecast:
Market size and trends: Understanding the overall market size and growth potential for your product or service is crucial.
Competitor activity: Analyzing your competitors’ strategies and offerings can help you anticipate their impact on your sales.
Marketing and sales efforts: Planned marketing campaigns and sales initiatives can significantly influence sales volume.
Unforeseen events: Be prepared to adjust your forecast based on unexpected events like economic downturns, natural disasters, or technological disruptions.
Sales forecasts are not crystal balls; they are based on estimates and assumptions. Use multiple forecasting methods to gain a more comprehensive view.
Accounts Receivable (A/R) Days Sales Outstanding (DSO)
The average number of days it takes a company to collect cash from its customers after goods or services are sold on credit.
It’s calculated as DSO = (Average Accounts Receivable / Credit Sales) × Number of Days in Period.
Interpretation:
- A lower DSO (e.g., 30 days) indicates efficient collection practices and strong cash flow.
- A higher DSO (e.g., 60 days) suggests potential cash flow concerns, slower collections, or lenient credit terms.
Impact on Financial Performance:
- A high DSO can tie up funds, limit growth opportunities, and increase financing costs.
- Strategies to improve DSO include offering early payment discounts, tightening credit policies, and implementing efficient collection processes.
Accounts Payable (A/P)
The amount a company owes to its suppliers for goods or services purchased on credit. It’s listed as a current liability on the balance sheet.
Interpretation:
- A higher A/P balance can indicate strong purchasing power and good relationships with suppliers.
- A lower A/P balance might suggest limited supplier relationships or missed potential discounts.
Impact on Financial Performance:
- Managing A/P effectively can optimize cash flow and leverage supplier relationships.
- Stretching payables too long can damage supplier relationships and harm creditworthiness.
Line of Credit Assumptions
A pre-approved borrowing limit that allows a company to draw funds as needed, up to a certain maximum, usually with interest charged on the used amount.
Interpretation:
- Lines of credit provide flexibility for unexpected expenses or short-term funding needs.
- Assumptions about interest rates, borrowing limits, and repayment terms are crucial for financial modeling and planning.
Impact on Financial Performance:
- Access to a line of credit can enhance financial resilience and support growth.
- Overreliance on lines of credit can lead to excessive debt and interest costs.
Income Tax Assumptions for 1 to 3 Years
Estimates of the income taxes a company will pay based on projected earnings, tax rates, and deductions.
Interpretation:
- Accurate tax assumptions are crucial for financial modeling, budgeting, and planning.
- Factors to consider include current tax legislation, industry norms, and potential changes in tax laws.
Impact on Financial Performance:
- Taxes directly affect available cash and profitability.
- Overly optimistic tax assumptions can lead to inaccurate financial projections and potential misrepresentation of earnings.
Amortization of start-up costs
Amortization of start-up costs refers to the process of gradually writing off the cost of certain start-up expenses over a set period, instead of expensing them all in the year they are incurred. This is done for accounting and tax purposes, as it provides a more accurate picture of the company’s financial performance over time.
Startup Operating Expenses
Operating expenses (OpEx) are the lifeblood of any business, representing the costs directly associated with running your core operations and generating revenue. They are crucial for understanding your efficiency and profitability.
Calculating OpEx
There are two main ways to calculate OpEx:
- Using the Income Statement(mainly for existing business): Locate the “Operating Expenses” section on your income statement. This section often lists subcategories, allowing you to analyze specific expense areas. Add up all listed expenses to get the total OpEx.
- Using a Formula:
Formula 1: OpEx = Revenue – Operating Income – Cost of Goods Sold (COGS)
Formula 2: OpEx = SG&A Expenses + COGS + Depreciation + Amortization
These formulas might vary depending on your accounting practices and industry standards. OpEx excludes non-operating expenses like interest, taxes, and gains/losses from investments.
Analyzing OpEx alone isn’t enough. Consider metrics like the OpEx ratio (OpEx / Net Sales) and EBITDA margin (EBITDA / Net Sales) * 100% to assess how efficiently you convert sales into profit.
Importance of Forecasting Startup Operation Expenses For 3 years
There are several compelling reasons why calculating operating expenses (OpEx) for 3 years is crucial for projection calculations in a startup:
Accurate Financial Planning and Forecasting
A 3-year projection allows you to anticipate future expenses associated with growth, hiring, marketing, and other vital business functions. This helps in:
Securing funding: Investors heavily rely on realistic projections to assess financial viability and potential return on investment.
Making informed decisions: A clear understanding of future expenses enables strategic planning for resource allocation, budgeting, and potential cost-saving measures.
Identifying potential risks: Proactive insights into rising costs or operational inefficiencies allow you to mitigate risks and adapt your business model.
Demonstrating Business Maturity and Credibility
Projecting OpEx for 3 years shows investors and stakeholders a long-term perspective and commitment to sustainable growth. This commitment translates to:
Increased confidence: A well-defined plan instills confidence in your ability to manage future expenses and achieve profitability.
Competitive edge: It differentiates you from startups lacking long-term planning, potentially attracting better funding opportunities.
Adapting to Market Dynamics and Growth
The business landscape is ever-changing, and a 3-year projection allows you to:
Factor in potential cost changes: This could include fluctuations in raw materials, labor costs, or regulatory shifts.
Plan for scaling: As your business grows, operational needs and expenses will evolve. Having a 3-year plan helps you anticipate and prepare for these changes.
Remain agile: The projection serves as a flexible framework, allowing you to adjust based on actual performance and emerging trends.
Assessing Financial Sustainability
By projecting OpEx over 3 years, you can:
Identify potential cash flow issues: You can assess if your projected revenue will adequately cover operational costs, highlighting potential financing needs.
Optimize pricing strategies: Understanding future expense trends allows you to set sustainable pricing that covers costs and ensures profitability.
Monitor profitability: Projecting how OpEx impacts gross and net margins over time helps you optimize operations for long-term financial health.
Startup Cashflow Projections
Cash flow refers to the net movement of cash into and out of a business during a specific period. It reflects the company’s ability to generate cash from its operations and meet its financial obligations.
Analyzing cash flow is crucial for understanding a business’s financial health, making informed decisions, and ensuring long-term success.
Cash Flow Components
1. Cash Inflow:
Money received by the business.
- Sales revenue
- Loan proceeds
- Investment Income
- Grant funding
Example: A customer paying for a product or service.
2. Cash Outflow:
Money paid by the business.
- Operating expenses (rent, salaries, supplies)
- Loan repayments
- Capital expenditures (equipment, property)
- Dividend payments
Example: Paying rent for office space.
Calculating Net Cash Flow:
You can’t directly apply a single formula to calculate cash flow.
However, the basic principle is:
Net Cash Flow = Cash Inflow – Cash Outflow
3. Operating cash balance (OCB)
Operating cash balance (OCB) is the amount of cash a company has on hand after accounting for all its operating expenses. It represents the cash readily available to fund day-to-day operations, pay bills, and seize short-term opportunities.
OCB = Beginning Cash Balance + Net Cash Flow from Operating Activities – Ending Cash Balance
Analysts and investors often use OCB to assess a company’s financial health and short-term liquidity. A high OCB indicates that a company is generating sufficient cash from its operations to meet its obligations and potentially invest in growth. Conversely, a low or negative OCB could signal potential financial difficulties.
4. Line of Credit Drawdown
A line of credit drawdown is the act of borrowing money from a pre-approved and revolving credit line established with a financial institution (e.g., a bank, or credit union).
Similar to a credit card, you only pay interest on the amount you borrow, offering flexibility and avoiding unnecessary interest charges on unused funds.
Startup Income Statement Projections
The income statement shows the flow of income and expenses during a specific period. It starts with the total revenue earned from selling goods or services and then subtracts all the expenses incurred to generate that revenue.
The resulting figure is the net income (profit) or net loss, indicating the company’s overall financial performance for the period.
While the income statement doesn’t have a single formula, it follows a specific structure:
Formula:
Net Income = Revenue – Expenses
Where:
Revenue: All the income generated from the company’s core operations, such as sales of goods or services.
Expenses: All the costs incurred to generate that revenue, categorized into:
Cost of Goods Sold (COGS): Direct costs associated with producing or acquiring the goods or services sold.
Operating Expenses: Indirect costs related to running the business, such as rent, salaries, marketing, and depreciation.
Other Expenses: Non-operating expenses like interest and taxes.
Analysis of the Income Statement
Gross Profit: Revenue minus COGS measures the profit earned after direct production costs.
Operating Profit: Gross profit minus operating expenses indicates the profit from core business operations before financing activities.
Net Income: Operating profit minus other expenses and taxes reflects the company’s overall profitability for the period.
Ratios: Various ratios like gross profit margin, operating profit margin, and net profit margin can be calculated to compare profitability across companies or over time.
Startup Projected Balance Sheet
The balance sheet, also known as the statement of financial position, is another fundamental financial statement alongside the income statement. It provides a snapshot of a company’s financial health at a specific point in time, typically the end of a reporting period like a quarter or year.
The balance sheet presents a company’s assets, liabilities, and shareholders’ equity at a specific date. It adheres to the fundamental accounting equation:
Assets = Liabilities + Shareholders’ Equity
This equation ensures every dollar on the company’s books is accounted for, representing a financial equilibrium.
Components Of Balance Sheet
Assets: Resources owned by the company that have future economic value, categorized as:
Current Assets: Cash, inventory, accounts receivable, etc., readily convertible to cash within a year.
Non-current Assets: Long-term assets like property, plant, and equipment, are not readily convertible to cash within a year.
Liabilities: Debts and obligations the company owes to others, categorized as:
Current Liabilities: Short-term debts due within a year, such as accounts payable and accrued expenses.
Non-current Liabilities: Long-term debts like loans and mortgages, due beyond a year.
Shareholders’ Equity: The company’s net worth, representing the claims of owners (shareholders) on the company’s assets after accounting for liabilities.
Breakeven Analysis of Startups
Break-even analysis is a financial tool used to determine the point at which a company’s total revenue equals its total cost, resulting in neither profit nor loss. It helps businesses understand how much they need to sell to cover their expenses and start making a profit.
FORMULA: = TOTAL FIXED EXPENSES/(GROSS MARGIN/SALES*100)
Financial Ratios for Startups
Financial ratios are powerful tools used to analyze a company’s financial health, performance, and efficiency.
Here’s a list of commonly used ratios, categorized by their purpose, along with their formulas.
Liquidity Ratios
These ratios measure a company’s ability to meet its short-term obligations.
Current Ratio: Current Assets / Current Liabilities
Quick Ratio: (Current Assets – Inventory) / Current Liabilities
Safety Ratios
Assess a company’s ability to meet its long-term debt obligations.
Debt-to-Equity Ratio: Total Liabilities / Shareholders’ Equity
DSCR = Net Operating Income / Debt Service
Profitability Ratios
Evaluate a company’s ability to generate profits.
Sales Growth: ((Current Period Sales – Previous Period Sales) / Previous Period Sales) * 100%
COGS to Sales: Cost of Goods Sold (COGS) / Sales
Gross Profit Margin: (Sales – COGS) / Sales * 100%
SG&A to Sales: Sales General & Administrative Expenses (SG&A) / Sales
Net Profit Margin: Net Income / Sales * 100%
Return on Equity (ROE): Net Income / Average Shareholders’ Equity
Return on Assets (ROA): Net Income / Average Total Assets
Owner’s Compensation to Sales: Owner’s Compensation / Sales
Efficiency Ratios: Analyze how effectively a company uses its resources.
Days in Receivables: (Average Accounts Receivable / Revenue) * Number of Days in Period
Accounts Receivable Turnover: Revenue / Average Accounts Receivable
Days Inventory: (Average Inventory / Cost of Goods Sold (COGS)) * Number of Days in Period
Inventory Turnover: Cost of Goods Sold (COGS) / Average Inventory
Sales to Total Assets: Net Sales / Average Total Assets
Enjoy using this template and let us know if you want us to make any other template.
Key Takeaways
- The template creates complete 3-year financial projections automatically by entering only Year 1 data.
- Covers all essential financials: income statement, cash flow, balance sheet, sales forecast, and break-even analysis.
- Helps startups plan funding, manage cash flow, and present data to investors or banks effectively.
- Built-in formulas reduce manual work and errors, making it easy even for non-finance users.
- Supports multiple formats (Excel, Google Sheets, OpenOffice) for flexibility and accessibility.
If you like this article, kindly share it on different social media platforms so that your friends and colleagues can also benefit from the same. Sharing is Caring.
Please send us your queries or suggestions in the comment section below. We will be more than happy to assist you.
Frequently Asked Questions
Do I need financial expertise to use this template?
No. The template is beginner-friendly with automated calculations—just input basic data like expenses, sales, and growth rates.
Why is only Year 1 data required?
The model uses growth rates and formulas to project Years 2 and 3 automatically, saving time and ensuring consistency.
Can this template be used for investor presentations?
Yes. It generates structured financial statements that are commonly required by investors and banks for funding decisions.
What key inputs should I prepare before using the template?
You should have estimates for startup costs, payroll, pricing, sales volume, and operating expenses.
How does the template help in cash flow management?
It tracks cash inflows and outflows, helping you identify shortages early and plan funding or cost adjustments.
Can I customize the template for my business model?
Yes. You can modify assumptions, growth rates, and categories to match your industry or startup needs.